Hive Scale Data
Know your bees, weigh your bees
The Hive Scale Display
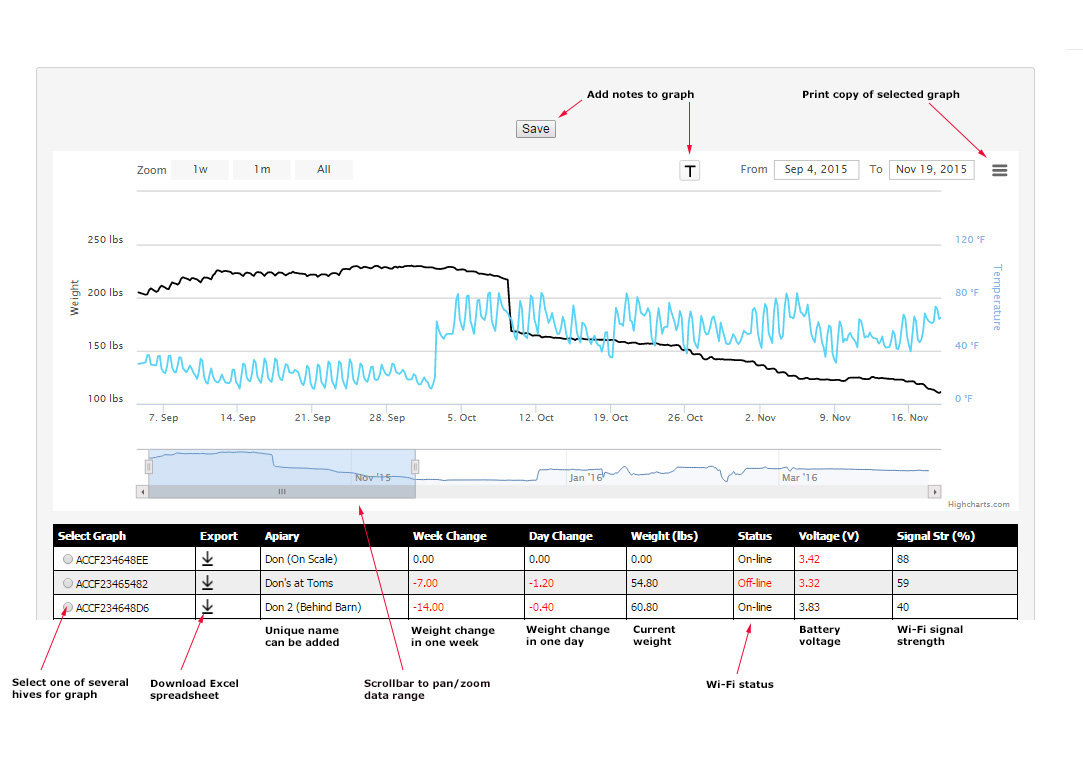
The Hive Scale Data Display lists all your hives with a summary of the current weight, weight change over the day, and weight change over the week. It shows the outside temperature, inside temperature and humidity (optional), battery voltage and signal strength for each scale. Each hive can be selected to show its hive weights daily, weekly, 1,2, 3 and 6-monthly, yearly or All.

Column 1: Each Wi-Fi Hive Scale has a unique identifier called the MAC address (Media Access Control). If the user has multiple hives, the radio button in front of the MAC address is used to select this particular scale to display its data in the graph.
Column 2: The "down arrow" icon is used to download all of the data from a given hive in CSV format. This format is used to import the data into a variety of applications, such as a spreadsheet for further analyses.
Column 3: Shows a unique name for a particular hive given by the beekeeper.
Columns 4,5,6: The next three columns provide the weight change in one week, the weight change in one day, and the current weight of the hive.
Column 7: Shows the status of the Wi-Fi connection. If the scale could not connect during the last attempt to transmit data, the column will indicate "Off-line" in red.
Column 8: Shows the signal strength of the connection
Column 9: Shows battery volts. When this value turns red, the battery must be changed.
Further Features:
- The weight and outdoor temperature are displayed in the graph. If the mouse is slid across the data, specific data points are seen in a pop up window.
- The slider bar at the bottom allows the user to selectively pan and zoom in on any area of the data.
- If the icon in the upper right is clicked on, the user is given a choice of how the graph can be printed.
Adding Notes to the graph
- Click on the "T" icon
- Click on the graph where the note should be placed
- Type the note
- Click on "Save"
Deleting Notes
- Double-click the note to delete it
- Click on "Save"
